Movers from NYC’s Biggest Boroughs Brought 91% More Income to the Capital Region
The number of taxpayers annually moving to the Capital Region from New York City’s three largest boroughs nearly tripled during the first year of the pandemic in 2020, and the amount of adjusted gross income (AGI) they brought with them almost doubled, according to a center for Economic Growth analysis of new IRS data.
Amid the pandemic, 2,863 personal income tax returns representing 4,945 individuals were filed by people living in six Capital Region counties in 2020 but who had lived in Manhattan, Brooklyn or Queens the prior year. The returns filed in the 2020 calendar year were for the 2019 tax year.1 Tax migration data for New York City’s other two boroughs (Bronx, Staten Island) is not available most Capital Region counties. Tax migration data covering the three boroughs is not available for the Capital Region counties of Warren and Washington.
Among the new Capital Region/former New York City residents, there was a 191.8 percent increase in returns last year3 and a 197.2 percent increase in individuals, when compared to returns filed in 20192. Among these New York City movers in 2020, there was also a $183.3 million, or 91.3 percent, increase in AGI to $384.1 million.
Albany County
New York City movers account for a large portion of the Capital Region’s new residents. In Albany County, the only county for which tax migration data is available for all five boroughs, New York City movers accounted for a fifth (19 percent) of the county’s inflow migration from outside the Capital Region. Albany County’s total inflow migration was 14,532 taxpayers, with 6,763 coming from the Capital Region’s seven other counties and 1,469 coming from New York City’s five boroughs. The Hudson Valley, minus Putnam and Sullivan counties, sent an additional 637 individuals to Albany County.
Columbia-Greene
In 2020, the number of returns filed by taxpayers who had moved from Brooklyn, Manhattan and Queens to Columbia and Greene counties increased by 159.3 percent to 980 and the number of individuals covered by them increased by 169.9 percent to 1,695. The AGI of movers from these three boroughs to Columbia and Greene Counties increased five-fold, or by $174.3 million, to $217.5 million.
County Performance
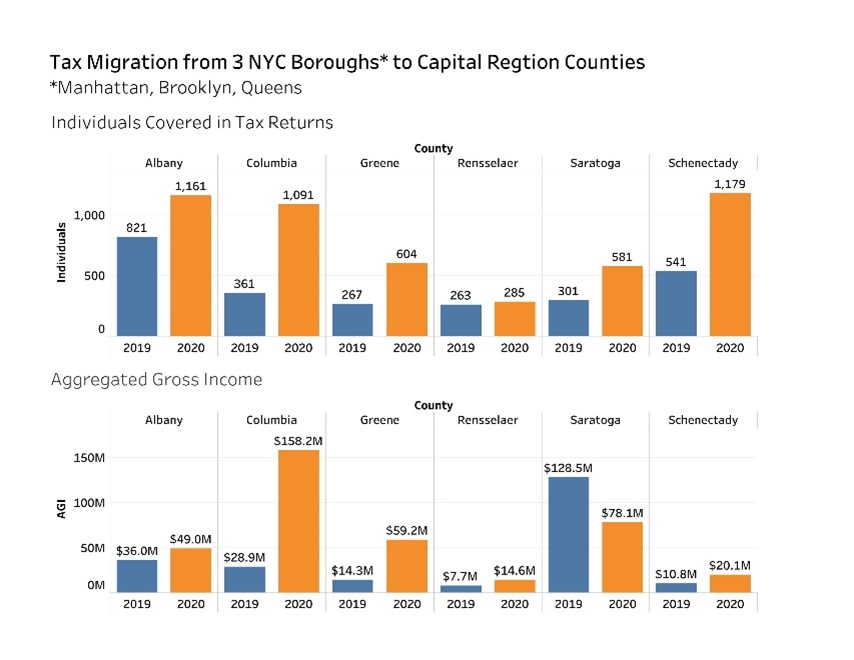
In 2020, Schenectady County led the Capital Region in individual tax migration from Brooklyn, Manhattan and Queens (1,179), followed by Albany County (1,161) and Columbia County (1,0921). Columbia County led the region in AGI tax migration from the three boroughs ($158.2 million), followed by Saratoga County ($78.2 million) and Greene County ($59.2 million). The fastest-growing counties for individual tax migration growth over the year from the three boroughs were Columbia County (202.2 percent), Greene County (126.2 percent) and Schenectady County (117.9 percent). The fastest-growing counties for AGI tax migration growth were Columbia County (448 percent), Greene County (313.4 percent) and Rensselaer County (89.8 percent).
CEG Initiatives
In April 2021, CEG launched a talent attraction campaign using the CapNY brand, along with a website – GoCapNY.com – and its associated social media channels. To help attract even more young professionals to the Capital Region, CEG launched a CapNY Connectors initiative. The Connectors are local residents who love living in the Capital Region and who have volunteered to share that love to help connect prospective new residents to our community. They work in diverse industries, pursue unique interests, and come from all walks of life. The CapNY Connectors are available to answer questions and discuss first-hand experience of what it’s like to work and live in CapNY.
Young professionals can find a connector who shares their interests and ambitions by checking out the profiles on the GoCapNY website. Website visitors who are unsure of whom they should connect with, can fill out the form to provide some additional details, and the CapNY networking team will make a connection for them.
Visit CapNY Connectors at https://gocapny.com/capny-connectors.
NOTES
1 According to the IRS: “Migration data are based on the population of Forms 1040 that were filed and processed by the IRS during calendar years 2019 and 2020. In addition, tax year 2019 paper returns were included up until mid-July of 2021 because of processing delays due to the COVID-19 pandemic.”
2 Filed in calendar year 2019 for the 2018 tax year.
3 Filed in calendar year 2020 for the 2019 tax year.
Don’t miss these insights into the trends that are shaping the Capital Region’s economy. Sign up for CEG’s e-news and follow us on:
![]()
![]()
![]()