How Should the Capital Region Be Defined?
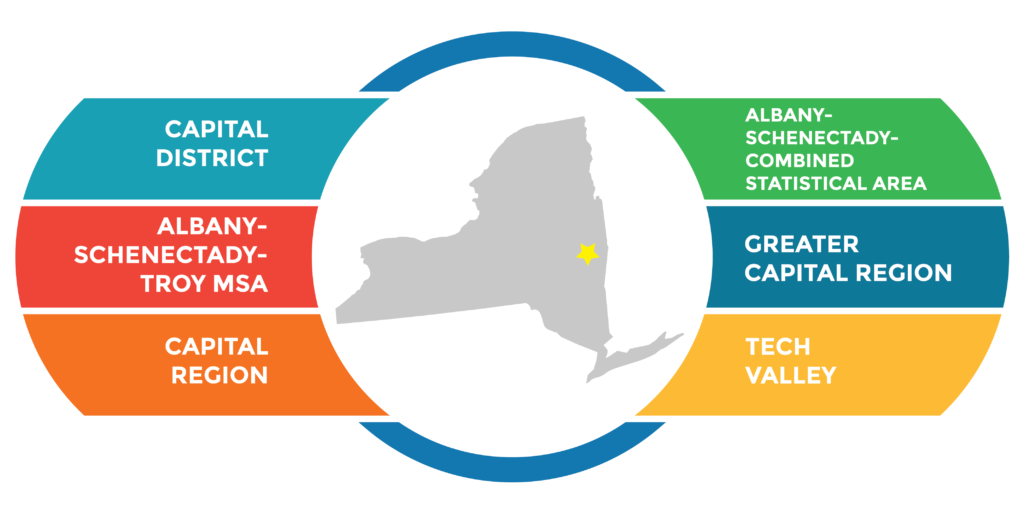
What is the Capital Region?
The answer largely depends on who is asking and why. Are its boundaries being drawn to serve the purpose of a commercial market, community planning, tourism, standardized statistical reporting or economic development?
With so many regional definitions circulating, it is easy to confuse them and the purposes they serve. Adding to the confusion are the federal government’s changing definitions for the region, otherwise known as the Albany-Schenectady-Troy metropolitan statistical area (MSA). For more than six decades, the U.S. Office of Management and Budget (OMB) has provided several definitions for this MSA, which has ranged from three to six counties. Since 1960, Albany, Rensselaer and Schenectady and Saratoga Counties have been staples in the MSA, with Montgomery, Greene and/or Schoharie counties appearing in subsequent definitions. Since 2003, OMB has delineated the MSA as containing Albany, Rensselaer, Saratoga, Schenectady and Schoharie counties.
Metro Areas
An MSA is defined as an “an area containing a large population nucleus and adjacent communities that have a high degree of integration with that nucleus.” However, instead of serving the purpose of economic development, this classification “provides a nationally consistent set of delineations for collecting, tabulating, and publishing Federal statistics for geographic areas.” MSAs require at least one urbanized area with at least 50,000 inhabitants. There are also or micropolitan statistical areas (µSAs), which likewise require one urbanized area but have a population between 10,000 and 49,999.
Commutershed
While media outlets place the greatest emphasis on MSAs because their data serves as the basis of national economic rankings1, these areas minimize the “substantial employment interchange” between contiguous MSAs and/or µSAs. Instead, OMB-delineated combined statistical areas (CSAs) do recognize such ties between these areas that are “less intense than those captured by mergers [for MSAs or µSAs], but still significant.” For example, the 10-county Albany-Schenectady CSA includes the Albany-Schenectady-Troy MSA, the Glens Falls MSA (Warren and Washington counties), the Amsterdam µSA (Montgomery County), Gloversville µSA (Fulton County) and Hudson µSA (Columbia County).” Greene County is excluded from this CSA because it is neither an MSA nor µSA . Catskill has a population over the minimum threshold for an µSA but is a town and not a city.
The strong commuting patterns, or commutersheds, highlighted by CSAs provide “a prime way for economists to define and understand regional economies.” They are “of most interest for regional economists,” according to Paul R. Flora, a research and policy support manager and senior economic analyst for the Federal Reserve Bank of Philadelphia.
Pros and Cons
Recent months have seen this topic of regional definition attract much media attention with some advocating for a delineation of the region that aligns with or closely resembles the five-county metropolitan statistical area (MSA) version. CEG has long advocated for a more expansive and inclusive view of the region that recognizes both the commutershed and key regional assets, such as research and development (R&D) infrastructure, the talent pipeline and nationally unique segments of the labor force.
Below is an analysis of the various ways the region has been defined and the pros and cons of subscribing to each one.2
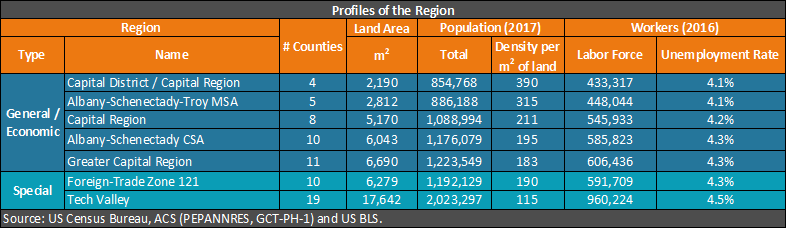
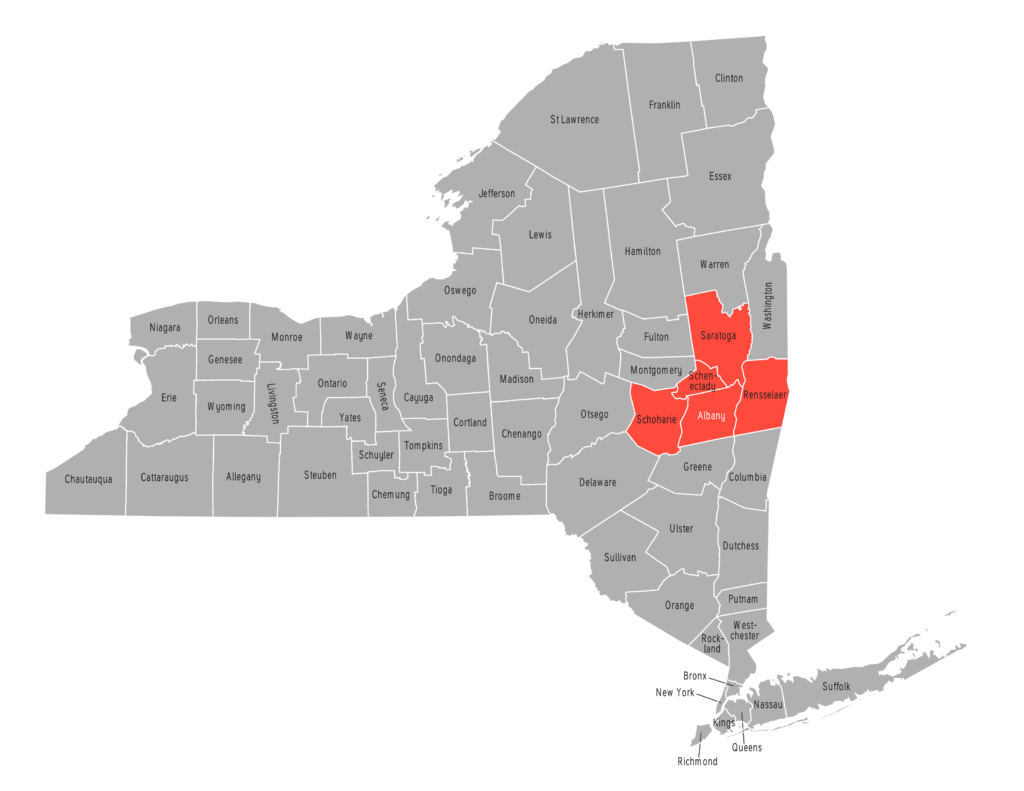
Capital District / Capital Region (4 counties)
Delineated by: Capital Region Chamber, Capital District Regional Planning Commission (CDRPC), U.S. Department of Commerce (US DOC) and Capital District Transportation Authority (CDTA)
Pros
• Captures the region’s leading R&D assets, academic institutions and largest employers
• All counties are served by CDTA
• Encompasses the area for which CDRPC develops a Comprehensive Economic Development Strategy (CEDS)
• Highest population density achievable, on par with those for the Nashville-Davidson-Murfreesboro-Franklin and Youngstown-Warren-Boardman MSAs
• Lowest unemployment rate
• Highest educational attainment (BA or higher)
Cons
• Population under 1 million
• Ignores the greater level of regional integration that has occurred since OMB last narrowly defined the MSA this way in 1971
• Very low unemployment rate could be unattractive to companies interested in relocating
• Less attractive to manufacturers: excludes Fulton, Montgomery and Washington counties, which have above-average concentrations of production workers (LQ>1)
• Less attractive to transportation and warehousing firms: excludes Fulton, Greene, Montgomery and Schoharie counties, which have above-average concentrations of transportation and materials moving workers (LQ>1)
• Less attractive to agricultural businesses: excludes Columbia, Schoharie and Washington counties, which have above-average concentrations of farm, fishing and forestry workers (LQ>1)
Albany-Schenectady-Troy MSA (5 counties)
Delineated by: OMB
Pros
• Captures the region’s leading R&D assets, academic institutions and largest employers
• Aligns with federal MSA definition
• Covers “an area containing a large population nucleus and adjacent communities that have a high degree of integration with that nucleus”
• Slightly more attractive to agricultural businesses: includes Schoharie County, which has an above-average concentration of farm, fishing and forestry workers (LQ>1)
• National media outlets, such as Forbes and S. News & World Report, use MSA data
Cons
• Population under 1 million
• Geographic size is 33 percent below average for an MSA with three principal cities
• One less county than the average for an MSA with three named principal cities
• OMB guidelines state MSA classifications are for “for collecting, tabulating, and publishing Federal statistics for geographic areas” – not specifically for economic development
• OMB’s guidelines for MSAs do “not produce an urban-rural classification”
• Less attractive to manufacturers: excludes Fulton, Montgomery and Washington counties, which have above-average concentrations of production workers (LQ>1)
• Less attractive to transportation and warehousing firms: excludes Fulton, Greene and Montgomery counties, which have above-average concentrations of transportation and materials moving workers (LQ>1)
• Less attractive to agricultural businesses: excludes Columbia and Washington counties, which have above-average concentrations of farm, fishing and forestry workers (LQ>1)
• Includes one county (Schoharie) within the Mohawk Valley Region, as defined by the Empire State Development Corp. (ESD)
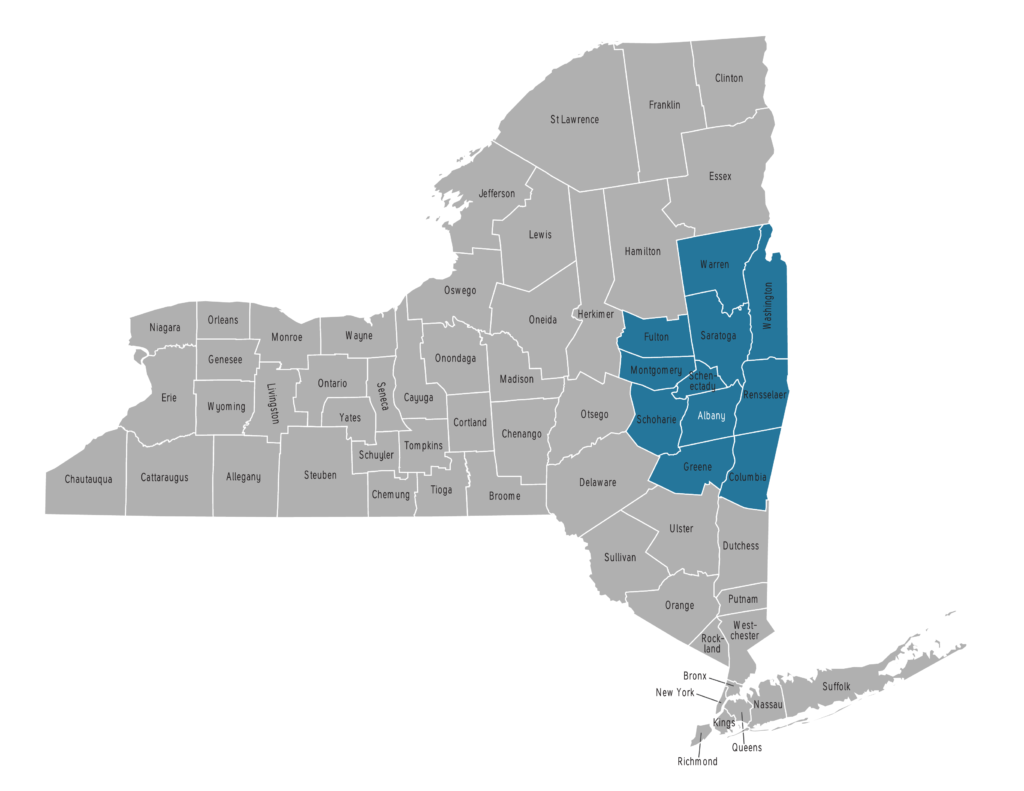
Capital Region (8 counties)
Delineated by ESD, Capital Region Economic Development Council (CREDC), National Institute of Standards and Technology’s Manufacturing Extension Partnership (NIST MEP) and CEG
Pros
• Population over 1 million
• Capital 20.20, the region’s five-year economic development plan, reflects this eight-county organization
• Captures the region’s leading R&D assets, academic institutions and largest employers
• Aligns with the state’s Regional Economic Development Council (REDC) strategy
• Aligns with NIST MEP’s regional footprint
• More attractive to agricultural businesses: includes Columbia and Washington counties, which have an above-average concentration of farm, fishing and forestry workers (LQ>1)
• Slightly more attractive to manufacturers: includes Washington County, which has an above-average concentration of production workers (LQ>1)
• Slightly more attractive to transportation and warehousing firms: includes Greene County, which has an above-average concentrations of transportation and materials moving workers (LQ>1)
• Enhances the region’s tourism and recreation appeal by surrounding itself with the Catskills, Berkshire and Adirondacks
• Closest in geographic size to the average for MSAs with three principal cities
• Partially produces an urban-rural classification
Cons
• Highest average housing value
Albany-Schenectady Combined Statistical Area (CSA)
Delineated by OMB
Pros
• Population over 1 million
• Composed of adjacent MSAs and µSAs with “substantial employment interchange”
• Captures the region’s leading R&D assets, academic institutions and largest employers
• More attractive to manufacturers: includes Fulton, Montgomery and Washington counties, which have above-average concentrations of production workers (LQ>1)
• More attractive to transportation and warehousing firms: includes Fulton, Montgomery and Schoharie counties, which have above-average concentrations of transportation and materials moving workers (LQ>1)
• Produces an urban-rural classification
Cons
• 44 percent larger than the average geographic size of MSAs with three principal cities
• Highest poverty rate (tie)
• Includes three counties (Fulton, Montgomery and Schoharie) within the ESD-defined Mohawk Valley Region
• Excludes Greene County
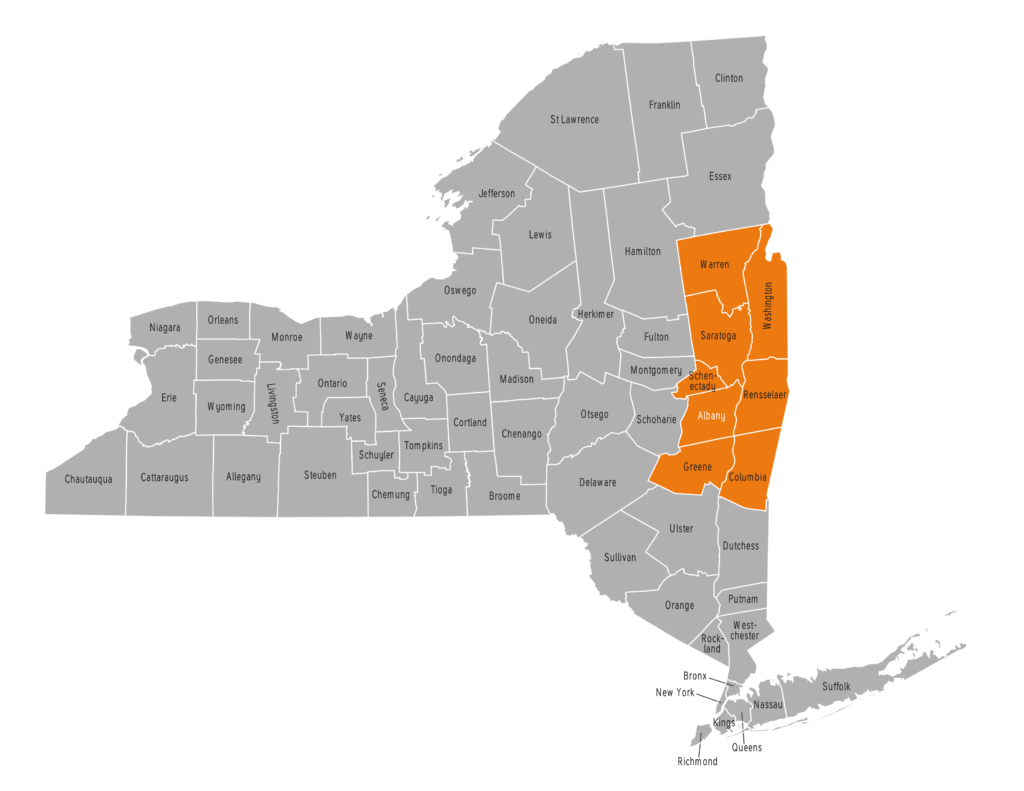
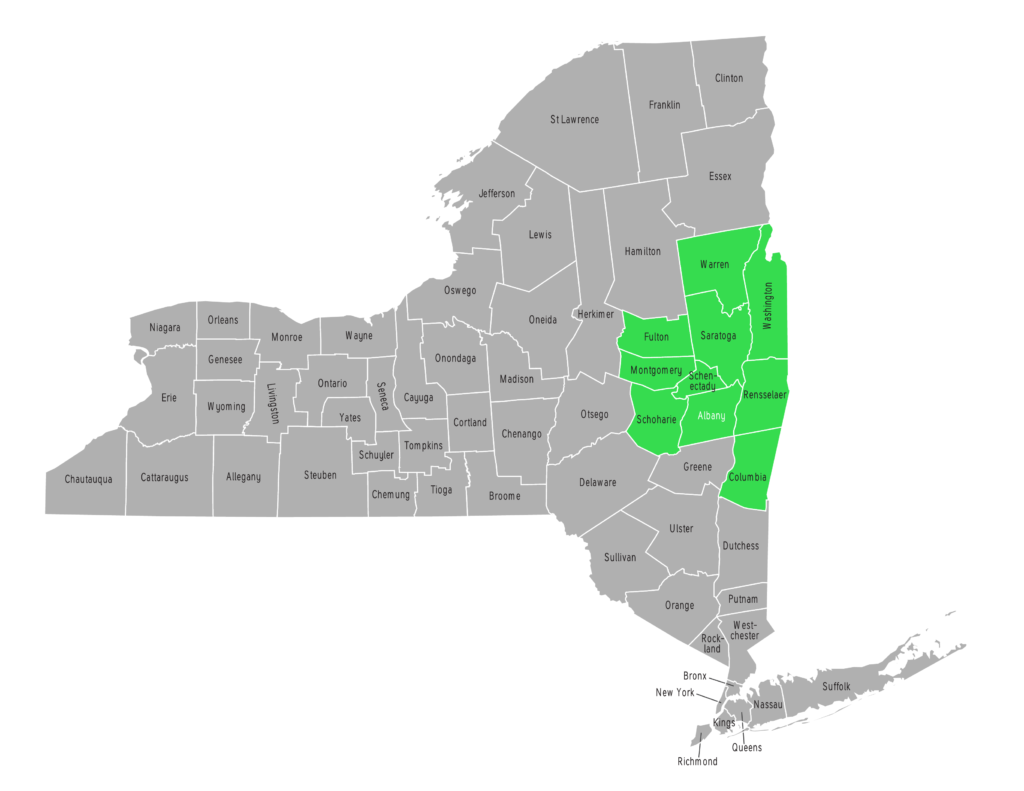
Greater Capital Region (11 counties)
Delineated by CEG and Greater Capital Region Workforce Investment Board
Pros
• Population over 1 million
• Captures the region’s leading R&D assets, academic institutions and largest employers
• More attractive to manufacturers: includes Fulton, Montgomery and Washington counties, which have above-average concentrations of production workers (LQ>1)
• More attractive to transportation and warehousing firms: includes Fulton, Greene, Montgomery and Schoharie counties, which have above-average concentrations of transportation and materials moving workers (LQ>1)
• Recognizes the increases in out-of-county commuters from Fulton and Warren counties
• Produces an urban-rural classification
Cons
• 59 percent larger than the average geographic size of MSAs with three principal cities
• Lowest educational attainment
• Highest poverty rate (tie)
• Includes three counties (Fulton, Montgomery and Schoharie) within the ESD-defined Mohawk Valley Region
Special Areas
Over the years, several delineations of the region have been made to serve a special purpose, such as to support trade or to appeal to a specific industry or company.
For example, Foreign-Trade Zone 121 is a 10-county region delineated by the U.S. Foreign Trade Board. It is a secure area deigned to expedite and promote foreign commerce and under the supervision of the U.S. Customs and Border Protection.
The original 19-county version of Tech Valley is a technology corridor that stretches from the New York’s northern border to Orange County in the lower Hudson Valley. It includes several of the state’s key semiconductor industry assets.
CEG’s Recommended Definition(s)
Depending on the type or scale of an economic development project, CEG recommends adoption of the eight-county Capital Region and 11-county Greater Capital Region, though the former should serve as the primary regional definition.
Through its involvement with the CREDC, the Local Government Council and New York Loves Nano, CEG for decades has played an important role in advancing a regional approach to economic development. CEG operates within the 11-county Greater Capital Region, though the footprint of its NIST MEP center, Business Growth Solutions, only covers the eight-county Capital Region.
Importantly, the Greater Capital Region captures the entire commutershed recognized by the Albany-Schenectady CSA. Greene County is not in this CSA because, in the least, it does not qualify as an µSA. However, Greene County’s close ties to Columbia County (the “Twin Counties”) and historical roots in the Albany-Schenectady-Troy MSA justifies its inclusion in both the Greater Capital Region and Capital Region.
With the creation of the state’s REDC process in 2011, and the CREDC tasking CEG with implementing Capital 20.20’s strategies, the organization has largely focused on economic development initiatives in the eight-county Capital Region. However, CEG continues to support workforce and economic development initiatives in the three outlying counties of Fulton, Montgomery and Schoharie.3
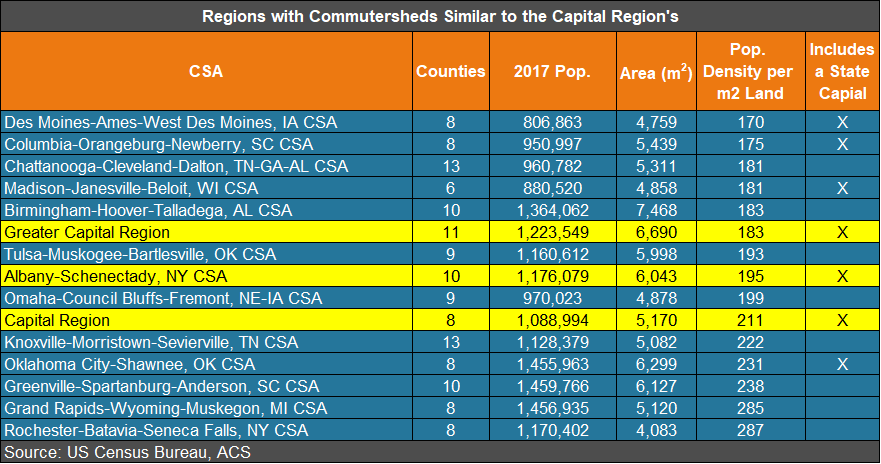
Regions with Geographic Areas & Commutersheds
In terms of size, population and density, the commutershed areas that most resemble the Capital Region are the Omaha-Council Bluffs-Fremont and Knoxville-Morristown-Sevierville CSAs. Other peer CSAs that contain a state capital are the Madison-Janesville-Beloit, Columbia-Orangeburg-Newberry, Oklahoma City-Shawnee and Des Moines-Ames-West Des Moines CSAs. The Columbia, Madison and Omaha CSAs contain MSAs that were identified as metros comparable to the Albany-Schenectady-Troy MSA in Capital 20.20, the region’s five-year economic development plan.
CEG Regionalization Efforts
CEG’s efforts to strengthen local regionalization include the following:
• Organizing meetings of the Local Government Council, a group of elected local officials from Capital Region villages, town and cities who gather to identify and discuss problems and economic opportunities.
• Promoting the region’s key tech industries at conferences worldwide, such as SEMI ISS US and Select USA
• Hosting events, such as last year’s 87/90 Semiconductor Summit and Business Connection Forum with Silicon Europe, to showcase the region’s R&D assets.
• Working with the CREDC to identify and advance projects of regional significance, as well as implementing Capital 20.20’s strategies and preparing the council’s annual Progress Report.
• Spearheading efforts to grow the region’s skilled talent pipeline by sponsoring a Manufacturing Intermediary Apprenticeship Program.
• Collaborating with regional partners to produce strong responses to requests for proposals (RFPs).
• Collecting, analyzing and publishing data and other information highlighting regional strengths.
Notes
1 In their national economic rankings, media outlets such as Forbes and U.S. New & World Report commonly refer to the Albany-Schenectady-Troy MSA simply as “Albany.”
2 Occupational location quotient (LQ) statistics are from EMSI.
3 When reporting regional statistics, CEG, to the greatest extent possible, will produce those for the eight-county Capital Region. In certain instances where data cannot be aggregated to generate a regional total, as is the case with median earnings, CEG will report whatever regional data is available, which is often that of the MSA.
Don’t miss these insights into the trends that are shaping the Capital Region’s economy. Sign up for CEG’s e-news and follow us on: