Study IDs Top Northeast Metros for University R&D Spending
New York City, Philadelphia and Boston have long been recognized as the Northeast’s leading research and development hubs, partly because of their concentration of prestigious higher education institutions. However, universities in a handful of smaller metropolitan statistical areas (MSAs) throughout the region are actually more intensely engaging in R&D activities.
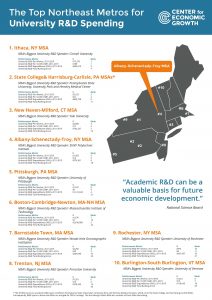
When the size of employment pools and gross metropolitan product (GMP) are taken into account – on top of total university R&D expenditures – the Northeast’s top five MSAs for academic R&D spending are: 1. Ithaca, 2. State College/Harrisburg-Carlisle, 3. New Haven-New Milford, 4. Albany-Troy-Schenectady and 5. Pittsburgh, according to a Center for Economic Growth (CEG) analysis of recently released National Center for Science and Engineering Statistics (NCSES) data.
Click here for a full list of the Top 20 Northeast Metros for University R&D Spending.
University R&D Expenditures
Academic R&D performers account for about 15 percent of the nation’s R&D activities. University R&D expenditures can be “a valuable basis for future economic development,” the National Science Board has noted.
For example, over the last five years, the Albany-Troy-Schenectady MSA has emerged as the second biggest gainer in manufacturing jobs throughout the Northeast.
Even more, out of the nation’s top 50 university engineering R&D spenders that year, only 10 institutions were in the Northeast – and two of them were in the Albany-Troy-Schenectady MSA: SUNY Poly and the Rensselaer Polytechnic Institute (RPI). SUNY Poly was the nation’s top spender on R&D for metallurgical and material engineering, with $290.6 million in expenditures in 2015. RPI ranked 17th for mechanical engineering R&D expenditures, which totaled $17.3 million, and 25th for electrical engineering expenditures, which totaled $18.8 million. RPI houses the state’s only active National Science Foundation Engineering Research Center.
“To remain competitive, manufacturers need access to advanced equipment and skilled researchers, and they have that in New York’s Capital Region,” said CEG President and CEO Andrew Kennedy.
Funding for university R&D expenditures comes from a mix of local, state, federal, institutional, business and other sources. For example, the majority of the Albany-Troy-Schenectady MSA’s university R&D funding in 2015 came from the federal government (31.3 percent) and businesses (37.3 percent). Those R&D dollars predominately went toward engineering (67.4 percent) and life sciences (19.9 percent) projects. This funding supported about 3,700 researchers.
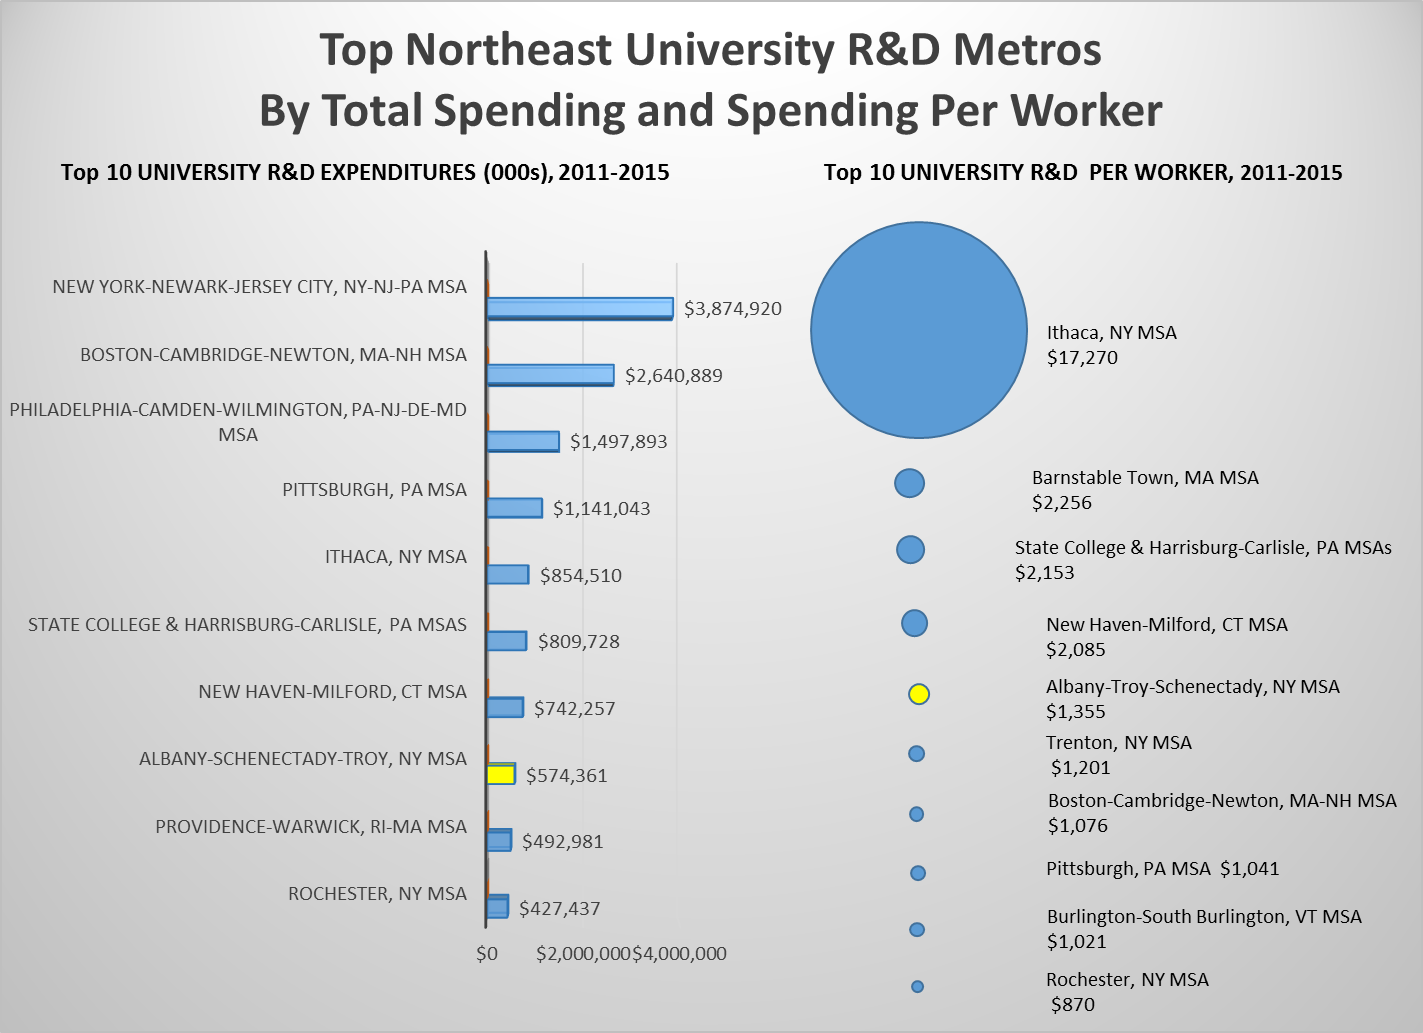
Between 2011 and 2015, the New York-Newark-Jersey City, Boston-Cambridge-Newton and Philadelphia-Camden-Wilmington MSAs were the Northeast’s biggest academic R&D spenders, with annual expenditures averaging $3.9 billion, $2.6 billion and $1.5 billion, respectively.
However, several far smaller metros also emerged as big university R&D spenders, particularly the Ithaca and Barnstable Town MSAs. Despite being some of the Northeast’s smallest MSAs by employment, they had the fifth and 16th highest levels of university R&D expenditures, annually averaging $854.5 million and $207.6 million during the five-year period, respectively.
Only a handful of MSAs, such as Albany-Troy-Schenectady and Rochester, had university R&D expenditure rankings that resembled their employment pool rankings. Albany was the ninth largest MSA by employment and ranked eighth for academic R&D spending, which averaged $574.4 million between 2011 and 2015. Rochester was the eighth largest by employment and the 10thbiggest academic R&D spender. In 2015 the University at Albany, Albany Medical College, SUNY Poly and RPI accounted for 98 percent of R&D expenditures in the Albany-Troy-Schenectady MSA. The Albany College of Pharmacy and Health Sciences, Siena College, Skidmore College and Union College also each had R&D expenditures exceeding $1 million last year.
University R&D Overreliance
A dozen of the Top 20 MSAs attributed three quarters or more of their average annual university R&D spending between 2011 and 2015 to a single institution. In fact, five MSAs were more than 99 percent reliant on one institution for university R&D spending. Aside from New York, Philadelphia and Boston metro areas, which benefit from expansive higher education networks, the Syracuse and Albany-Troy-Schenectady MSAs had the Northeast’s most diversified university R&D spending bases, with both on average being 55.5 percent reliant on a major institution (Syracuse University and SUNY Poly, respectively) during the five-year period.
“Academic R&D assets are extremely attractive to a variety of companies, from those in the semiconductor industry to others in the software sector and biotech industries. The Capital Region’s R&D engines are playing a pivotal role in driving robust employment growth in the manufacturing and technology sectors at a time when more than half of the Northeast’s 50 MSAs experienced employment declines in their manufacturing sectors. Investments in these R&D assets are vital – and they’re yielding impressive returns,” said Kennedy.
University R&D per Worker
Due to their size, large metro areas tend to have higher levels of university R&D expenditures than their less populated counterparts. However, a per capita assessment “provides a way of gauging the intensity of innovative effort, controlling for size,” the University of Kansas Institute for Policy and Social Research notes. Due to the size of its employment pool and the presence of Cornell University, the Ithaca MSA led the Northeast with a university R&D per worker of $17,270 during the five-year period. Cornell had $954.4 million in R&D expenditures in 2015 – the 12th highest amount in the nation. The Albany-Troy-Schenectady MSA was the Northeast’s ninth largest metropolitan statistical area (MSA), but its higher education institutions spent an average $1,355 per worker on R&D each year during the same period – the fifth highest level in the Northeast.
University R&D Intensity
Between 2011 and 2015, R&D spending at higher education institutions accounted for an annual average $12 per $1,000 of the Albany-Troy-Schenectady MSA’s average annual gross metropolitan product (GMP) – the fifth highest in the Northeast. This metric (university R&D expenditures/$1,000 GMP) is referred to as “university R&D intensity.”
The Organization for Economic Co-operation and Development notes that R&D intensity is used “as an indicator of the R&D effort made by an economy relative to its overall size.” The university R&D intensity rankings for several MSAs, including those in the overall top six, mirrored their university R&D per worker rankings.
University R&D Spending in the Northeast
Out of the 50 MSAs in the U.S. Census Bureau-defined Northeast Region, about three dozen had university R&D expenditures reported by NCSES between 2011 and 2015. When the MSAs are ordered in accordance to their total ranking score, the Albany-Troy-Schenectady MSA emerges as the Northeast’s overall fourth best metro area for university R&D spending. The total ranking score is the sum of the rankings for university R&D expenditures, university R&D per worker and university R&D per $1,000 GMP. Click here for a full listing of the top 20 Northeast metros for university R&D spending.
Methodology
For this study, the Center for Economic Growth (CEG) used higher education research and development (R&D) expenditure data from the National Center for Science and Engineering Statistics (NCSES), gross metropolitan product (GMP) data from the U.S. Bureau of Economic Analysis (BEA) and employment data from the U.S. Bureau of Labor (BLS). The study examines MSA’s 2011-2015 averages for university R&D expenditures, similar to how the Brookings Institution focused on five-year averages for MSA patent generation in its “Patenting and Innovation in Metropolitan America” report. The formula for university R&D per $1,000 GMP was modeled after the one used by the National Science Board (NSB) for measuring state financial R&D outputs in its annual Science and Engineering Indicators reports, except the NSB formula uses annual totals rather than five-year averages.
For 2014 and 2015, NCSES only provides the total university R&D expenditures for the SUNY Polytechnic Institute, rather than break out spending at the institution’s Albany campus in the Albany-Troy-Schenectady MSA and its Utica campus in the Utica-Rome MSA. For this study, the R&D expenditures at SUNY Poly’s Albany and Utica campuses reflect the share of funding between the Universities at Albany’s College of Nanoscale Science and Engineering and the SUNY Institute of Technology in 2013, before they merged. The NCSES survey on academic R&&D spending combines Pennsylvania State University’s University Park and Hershey Medical Campus, which are in the State College and Harrisburg-Carlisle MSAs. Consequently, these two MSAs are merged in CEG’s ranking.
For rankings, each metropolitan statistical area (MSA) was ranked by its level of university R&D expenditures, university R&D per worker and university R&D per $1,000 GMP. The sum of each MSA’s three metrics rankings provided a total ranking score, by which the MSAs were ordered for an overall ranking. Lower total ranking scores indicate stronger overall university R&D spending performance. When two MSAs had the same total ranking score, the one with the higher university R&D expenditures received a higher overall ranking.
County breakdowns of MSAs are in accordance to the U.S. Office of Management and Budget’s 2015 MSA delineations. Northeastern states are those included in the U.S. Census Bureau’s Northeast Region.
Subscribe/Like
For more information, contact CEG Director of Research and Communications James Schlett at jamess@ceg.org. Don’t miss these insights into the trends that are shaping the Capital Region’s economy. Sign up for CEG’s e-news.